P value and confidence interval
1. What is P value?
H0=There is no difference in the effect of fertilizers.
There are many tests to examine this null hypothesis:

In t test, if P=0.02, 2 out of 100 the null hypothesis will be true. So the question is should we consider this p value significant? The matter of concern is that the researcher who is doing the research should fix the level of significance before the start of his research. So, if the researcher has fixed the level of significance at 0.05, then as the obtained p value 0.02<0.05, the null hypothesis is rejected. That means there is significant difference in performance of Fertilizer A and Fertilizer B.


Why is confidence interval used?


P value is the probability value. It indicates that the result occured by chance alone or not. If the p value is small, it indicates the result was unlikely to have occured by chance alone. In this case, we say the result to be significantly different.
P Value is the probability for null hypothesis to be true. Null hypothesis is the hypothesis which treats everything equal or same. Suppose we have two doses of fertilizers being feed to a crops, then our null hypothesis will be:
H0=There is no difference in the effect of fertilizers.
There are many tests to examine this null hypothesis:
- t test=comparision of means
- F test=comparision of variance
- ANOVA =Analysis of variance e.t.c.
Final results of each test is judged on the basis of p value obtained. P value takes any value from 0 to 1. Example
p value=0.1 means if I repeat an experiment 100 times, the null hypothesis will be true for 10 times.
p value=0.5 ; 50 out of 100 times, the null hypothesis will be true.
In t test, if P=0.02, 2 out of 100 the null hypothesis will be true. So the question is should we consider this p value significant? The matter of concern is that the researcher who is doing the research should fix the level of significance before the start of his research. So, if the researcher has fixed the level of significance at 0.05, then as the obtained p value 0.02<0.05, the null hypothesis is rejected. That means there is significant difference in performance of Fertilizer A and Fertilizer B.
Small p value shows that it is greater than chance alone, something happened and the test is significant. Whereas, large p value indicates that the result is within chance or normal sampling error. In other words, nothing happened and the test is not significant. Lets see the example below:
The reported p value is very small at p=0.002 which indicates that the result is beyond chance and is statistically significant.
But, in this case, the p value is not so small and the result is within normal sampling error (not beyond chance) and is not statistically different.
2. So, what is Alpha?
For interpreting whether the p value is significant or not, we need to know the level of alpha being used for the test. The level of alpha used are 0.05, 0.01 and 0.001. Alpha should be decided beforehand by the researcher.
Alpha is the threshold value for judging a test statistic is significant or not. It represents an acceptable probability of a type I error in any statistical test. As alpha corresponds to probability, it ranges from 0 to 1. In statistical test 0.001, 0.01 and 0.05 are commonly used values for alpha that represents 1%, 5% and 10% chance of a TYPE 1 error occurring (i.e. rejecting a null hypothesis that is correct, in other words probability of making wring decision). If the p value of a test equals to or less than the chosen level of alpha, it is said to be statistically significant, otherwise not.
If alpha(α) =0.05, then following rules should be applied:
- If P<α then the test is significant
- If P>α then the test is not significant
Same decision rule is applied for α =0.01 and α =0.001 . Generally P<0.05 is denoted by *, P<0.01 is denoted by ** and P<0.001 is denoted by ***.
3. What is confidence interval?
Confidence interval is the range of values where we are fairly sure that our true values lies in. In other words, it is the range of values that's likely to include a population value with a certain degree of confidence. It is often expressed as % whereby a population means lie between an upper and lower interval.
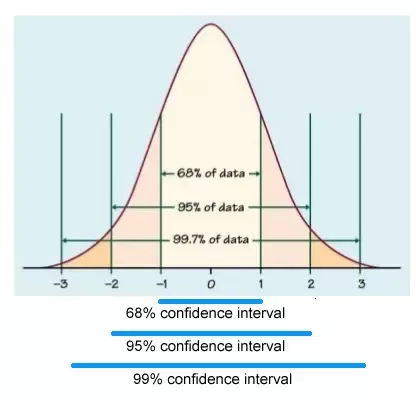
The 95% confidence interval is a range of values that certainly have 95 chances out of 100 to contain true mean of a population. As a researcher goes on increasing the sample size, the range value will be more narrow, which notifies that the mean will be obtained with much accuracy compared with a smaller sample.
Based on the figure above, it can be said that the probability of the population mean value being between -1.96 and +1.96 standard deviation (z scores) from the sample mean is 95%. Moreover, there is 5% chance that the population mean lies outside the upper and lower confidence interval ( as illustrated by 2.5% of outliers on the either side of the 1.96 z score). Suppose that at 95% CI we found average yield was 10±2.3 T/Ha. It says that the yield of corn is likely to be between 7.7t/ha and 12.3 t/ha. But it might not be as well. The 95% CI says that 95% of study like this will include true mean but 5% won't. So, there is 1 in 20 study that CI won't include true mean.
After deciding the confidence interval we want, we should see the z values for confidence interval.
From the table above, Z value for 95% confidence interval is 1.96. Now, use the formula below :
Where,
X bar is mean
Z is Z value
s is standard deviation
and n is number of observation
Suppose mean=10, s.d.=4 n=25 then the interval is 10±1.568. The value after ± is called as margin of error.
The formula for CI is :
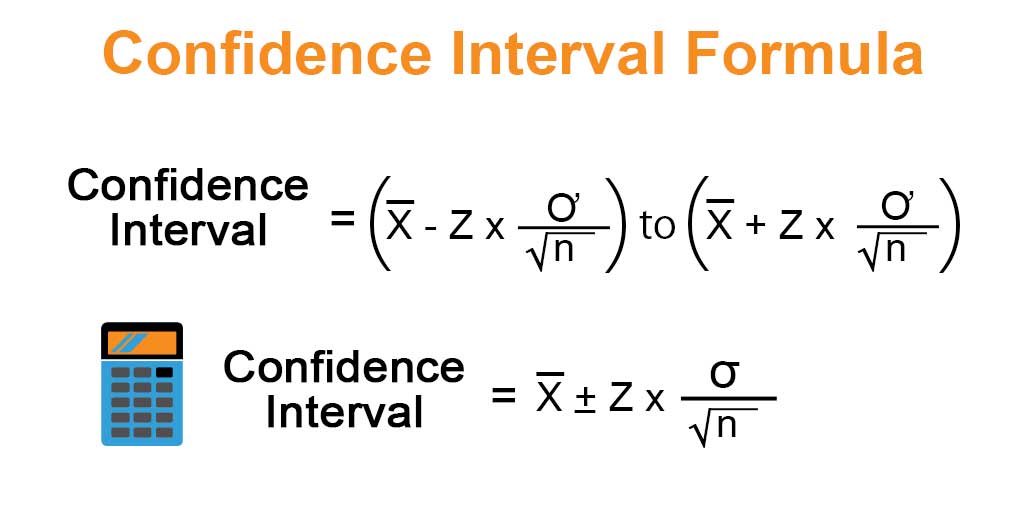
The formula for CI is :
Best estimate± Margin of error
whereas, margin of error=Z x estimated standard error
You can calculate confidence interval from the following website.
https://www.mathsisfun.com/data/confidence-interval-calculator.html
https://www.mathsisfun.com/data/confidence-interval-calculator.html
The snapshot is shown below:
As the study of entire population is not possible so, the researcher takes a sample or sub population for study. Doing so, he can only estimate the parameter (characteristics of population) and the estimated range being calculated from a given sample. So, for this a confidence interval helps him in measuring how well the sample represents the population. The probability that the confidence interval includes the true mean value within the population is called the confidence interval.
The narrow the interval (upper and lower values) the more precise will be the estimate. The increase in sample size will narrow down the range of upper and lower values.
Reporting a confidence interval in APA 6th edition style:
The bigger the confidence level, the wider is CI because CL refers to the % of all possible samples that can be expected to include the true population parameter. E.g. suppose all possible samples were selected from the same population and CI was computed for each sample. A 95% CL implies that 95 % of CI would include the true population parameter. 5% of interval won't contain the parameter.

When reporting confidence intervals, use the format: 95% [LL,UL], where LL is the lower limit of confidence interval and UL is the upper limit. For example ; 95% CI [5.68,8.92].
The bigger the confidence level, the wider is CI because CL refers to the % of all possible samples that can be expected to include the true population parameter. E.g. suppose all possible samples were selected from the same population and CI was computed for each sample. A 95% CL implies that 95 % of CI would include the true population parameter. 5% of interval won't contain the parameter.


posted by subodh @ 3:24 AM
3 Comments
![]()


3 Comments:
Very important information for researchers. Thank you for this sir!
Nice
Very useful content.. Thank you sir for this!
Post a Comment
Subscribe to Post Comments [Atom]
<< Home